This functions calculates three indices (Davies-Bouldin, Calinsky-Harabasz and average Silhouette score) for each k. Calculations are made for a single sample and for a default range of k that goes from 2 to 10.
Usage
evaluate_sample_k(
  data,
  sample_id,
  samples_col = "Sample",
  abundance_col = "Abundance",
  range = 2:10,
  with_plot = FALSE,
  ...
)
Arguments
- data
a data.frame with, at least, the classification, abundance and sample information for each phylogenetic unit.
- sample_id
String with name of the sample to apply this function.
- samples_col
String with name of column with sample names.
- abundance_col
string with name of column with abundance values. Default is "Abundance".
- range
The range of values of k to test, default is from 2 to 10.
- with_plot
If FALSE (default) returns a vector, but if TRUE will return a plot with the scores.
- ...
Extra arguments.
Details
Note: To get the indices for all samples, use evaluate_k() instead.
Data input
This function takes a data.frame with a column for samples and a column for abundance (minimum), but can take any number of other columns. It will then filter the specific sample that you want to analyze. You can also pre-filter for your specific sample, but you still need to provide the sample ID (sample_id) and the table always needs a column for Sample and another for Abundance (indicate how you name them with the arguments samples_col and abundance_col).
Output options
The default option returns a data.frame with Davies-Bouldin, Calinsky-Harabasz and
average Silhouette scores for each k. This is a simple output that can then be used
for other analysis. However, we also provide the option to show a plot (set with_plot = TRUE).
Three indices are calculated by this function:
Davies-Bouldin with
check_DB();Calinsky-Harabasz with
check_DB();average Silhouette score
check_avgSil().
Examples
library(dplyr)
#
evaluate_sample_k(nice_tidy, sample_id = "ERR2044662")
#> DB CH average_Silhouette k
#> 1 0.03821785 677.3258 0.9770110 2
#> 2 0.37218659 1821.4258 0.9521452 3
#> 3 0.52717038 2054.8869 0.8820316 4
#> 4 0.41316515 4933.9560 0.8561774 5
#> 5 0.42926962 5465.1344 0.8398216 6
#> 6 0.33508359 17589.0320 0.8479872 7
#> 7 0.38929657 17179.8092 0.7843358 8
#> 8 0.39480258 18083.3126 0.7740169 9
#> 9 0.32944506 30332.3447 0.7701163 10
# To change range
evaluate_sample_k(nice_tidy, sample_id = "ERR2044662", range = 4:11)
#> DB CH average_Silhouette k
#> 1 0.5271704 2054.887 0.8820316 4
#> 2 0.4131651 4933.956 0.8561774 5
#> 3 0.4292696 5465.134 0.8398216 6
#> 4 0.3350836 17589.032 0.8479872 7
#> 5 0.3892966 17179.809 0.7843358 8
#> 6 0.3948026 18083.313 0.7740169 9
#> 7 0.3294451 30332.345 0.7701163 10
#> 8 0.2782100 55354.240 0.7629755 11
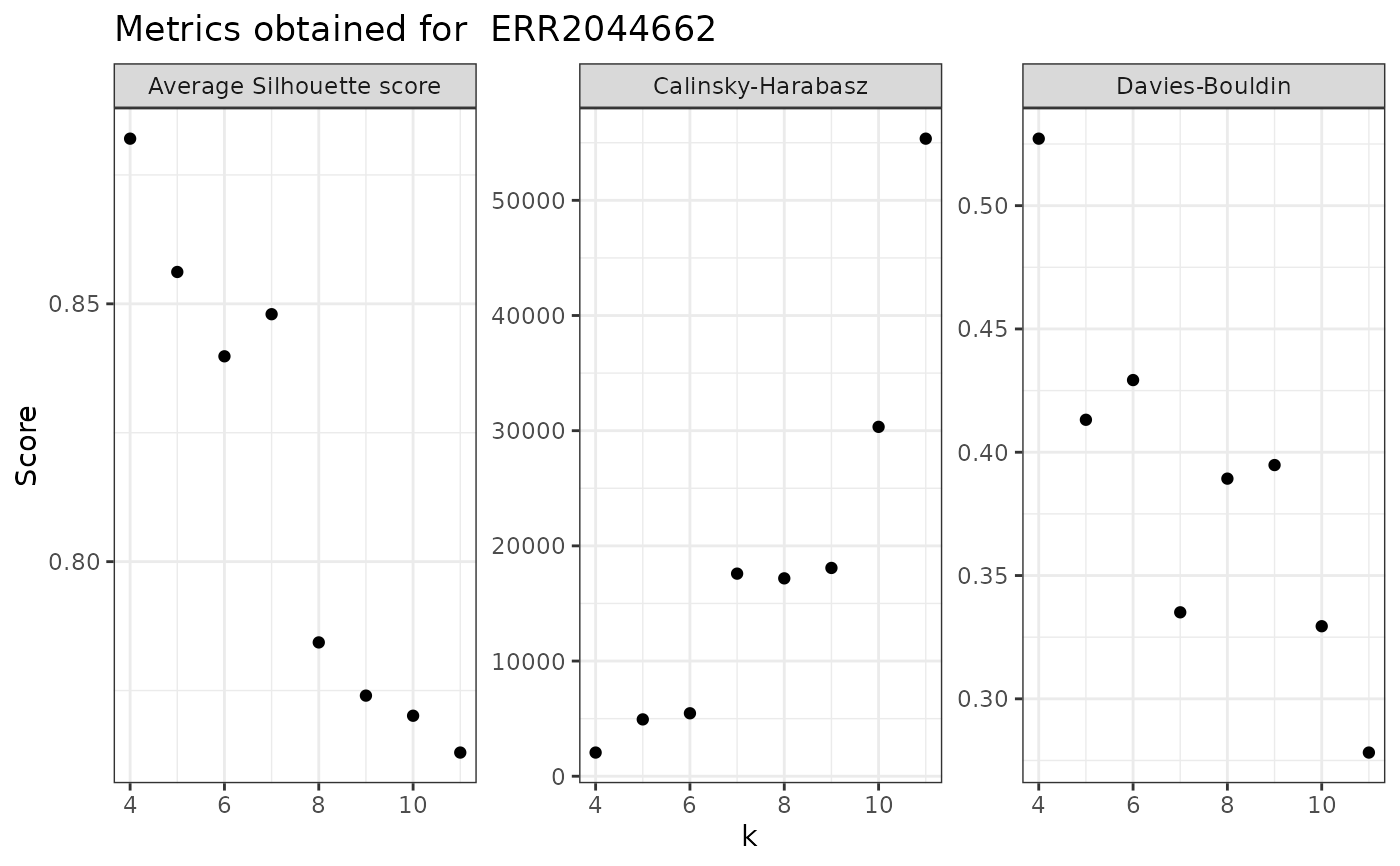
# To make simple plot
evaluate_sample_k(nice_tidy, sample_id = "ERR2044662", range = 4:11, with_plot =TRUE)