This function extends evaluate_sample_k() for any number of samples in a dataset.
Usage
evaluate_k(
  data,
  range = 2:10,
  samples_col = "Sample",
  abundance_col = "Abundance",
  with_plot = FALSE,
  ...
)
Arguments
- data
a data.frame with, at least, the classification, abundance and sample information for each phylogenetic unit.
- range
The range of values of k to test, default is from 2 to 10.
- samples_col
String with name of column with sample names.
- abundance_col
string with name of column with abundance values. Default is "Abundance".
- with_plot
If FALSE (default) returns a vector, but if TRUE will return a plot with the scores.
- ...
Extra arguments.
Details
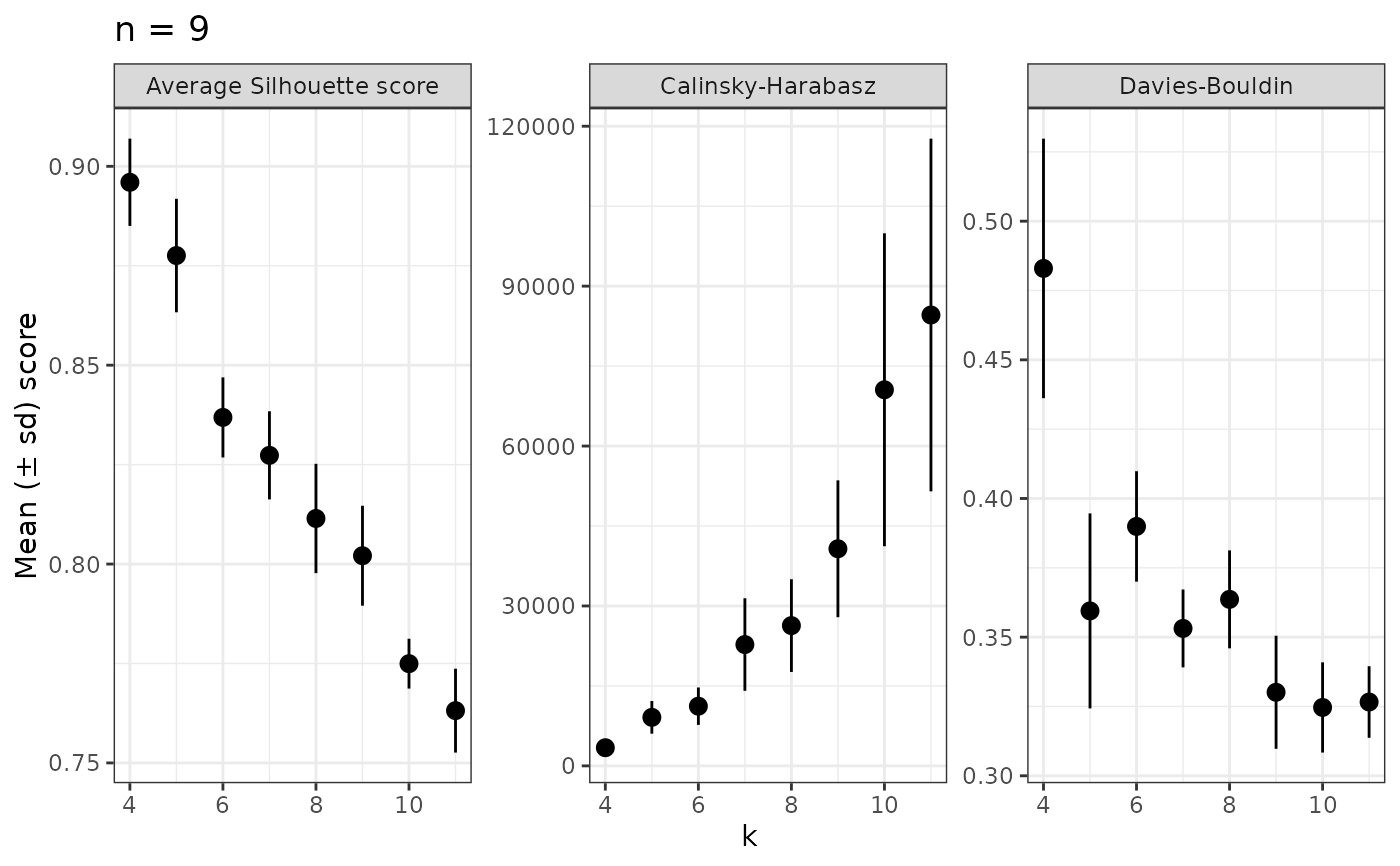
The plot option (with_plot = TRUE) provides centrality metrics for all samples used.
For more details on indices calculation, please see the documentation for evaluate_sample_k(), check_DB(),
check_CH() and check_avgSil().
Examples
# \donttest{
library(dplyr)

#' evaluate_k(nice_tidy)


# To make simple plot
evaluate_k(nice_tidy, range = 4:11, with_plot =TRUE)
#> No summary function supplied, defaulting to `mean_se()`
#> No summary function supplied, defaulting to `mean_se()`
#> No summary function supplied, defaulting to `mean_se()`

# }
# }